The Simbra society moved over to the new selection indexes and also moved onto a new version of Breedplan (V6.2). This newer version of Breedplan contained some updates to the models, particularly for the Days to Calving Model. Three main changes were made to the days to calving model. Firstly, penalty determination (for animals who skipped), secondly heterosis adjustments will be made based off multibreed research conducted in Australia and lastly the age of first record.
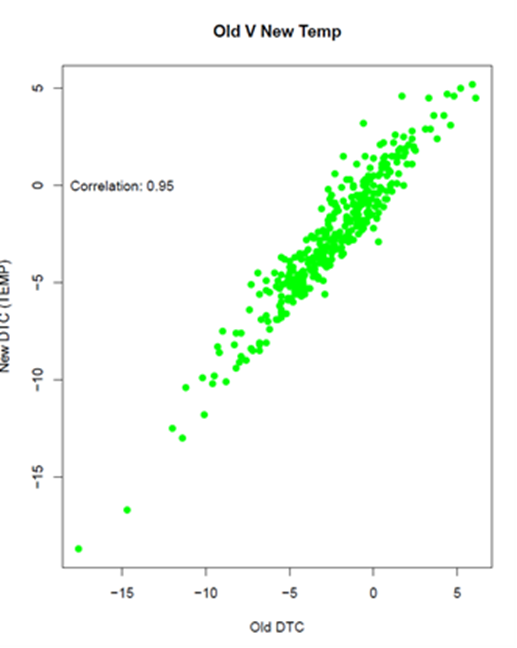
Changing the age at first record allows animals to be analysed for DTC from a younger age and age will cause a contemporary group “re-structure”, thus driving the biggest differences in the trait. It is important to note, that these differences are not always a bad thing. For example, by allowing the age at entry into a contemporary group to be younger, we are more “inclusive” of the data, and thus have potentially fewer but larger contemporary groups which allows more accurate comparisons to be made between animals in a contemporary group. The differences between the old and new DTC EBVs are not that extreme. The correlation between the old and new EBV for the published sires is 0.95 (see graph above).
The Breed Improvement Committee has worked very closely with professionals from ABRI and Breedplan in Australia over the past year. To construct 3 indexes:
Self-Replacing Feedlot Index (SRF) – Estimates the genetic differences between animals in net profitability per cow joined for a herd that keeps replacement females and requires a moderate emphasis on calving ease. Progeny age at turnoff is 14/15 months after 120/150 days of extra feed. Steers target 510 kg live weight (275 kg carcase weight) and heifers target 445kg (260kg carcase weight). Emphasis was placed on carcase quality.
Self-Replacing Weaner Index (SRW) – Estimates the genetic differences between animals in net profitability per cow joined for a herd that retains replacement females while excess progeny are sold at weaning. Use this index in conjunction with the self-replacing feedlot index to maximize selection pressure on your replacement females while targeting the feedlot sector endpoint for excess progeny. Significant emphasis is placed on calving ease, 200-day weight, days to calving and carcase yield while moderating mature cow weight.
Self-Replacing Grassfed Index (SRG) – Estimates the genetic differences between animals in net profitability per cow joined for a herd that keeps replacement females and requires a moderate emphasis on calving ease. Progeny age at turnoff is 23 months off pasture. Steers are around 500 kg live weight (260 kg carcase). Emphasis is placed on carcase quality.
Please see the Technical Specifications Sheets (BREEDPLAN – South African Simbra Selection Indexes: Technical Specifications (une.edu.au). They provide, in detail, an explanation of the indexes and the graphs relating to each index. It is important to note that we DO expect there to be differences between the old and the new indexes, the general consensus was that the old indexes were not working as they were supposed to, and the request was to rectify that – so we applied a new approach. For this reason, direct comparison of the old and the new will not be informative.
The BreedObject software generates the Blue, Red and Green Graphs that you see in the technical sheets. You’re probably wondering, how did we get to those weightings?
The BIC sets up a Breed Objective for each target market based off survey results (A summary of that target market is defined in the descriptions above). The software evaluates this information and then determines which profit drivers are important for us to achieve that defined target. Furthermore, the software then assesses what emphasis needs to be applied to each EBV trait to achieve maximum profit in the target market for which it was designed. BreedObject is a very complex software that considers input costs, income, genetic variation, and the relationship between traits when calculating these weightings.
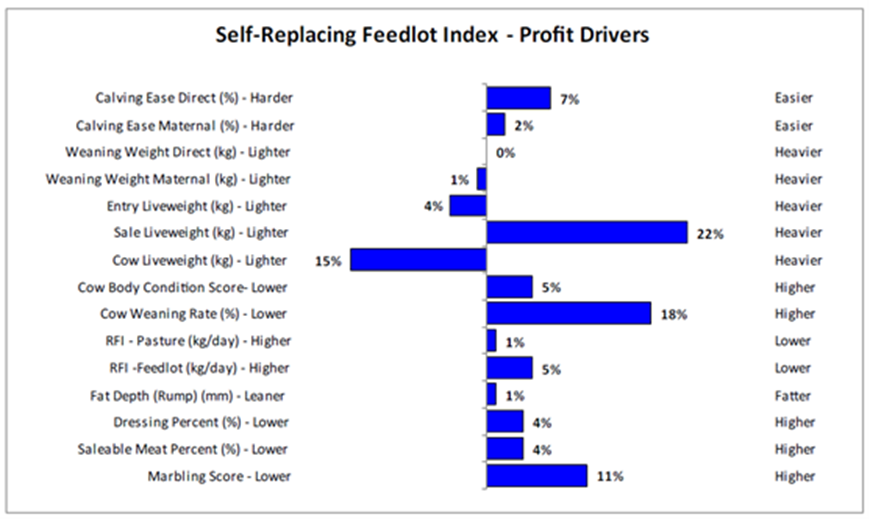
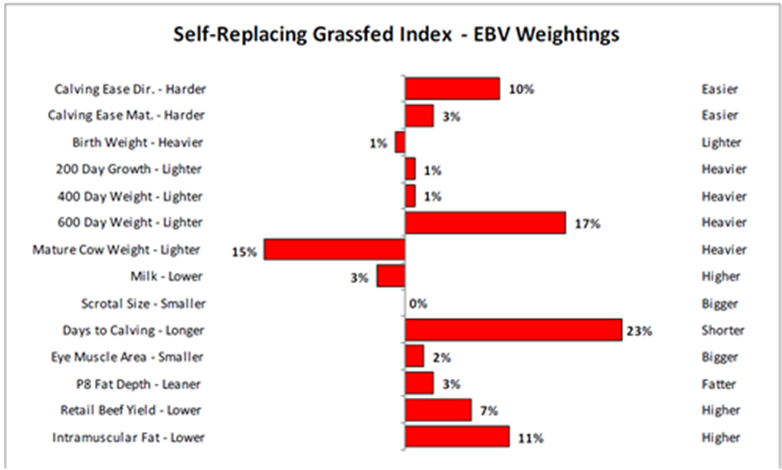
The blue graph depicts traits, based off the survey results, that are considered to drive profit within the defined market. For example, the Self-replacing Grassfed Index was designed to target a market where replacements are kept as females, making calving ease of moderate importance. Progeny are sold at 23 months off the veld and by this time steers are expected to have a liveweight of approximately 500kg and slaughter out to a carcass weight of approximately 260kg, while considering meat quality characteristics. For simplicity, lets break this up into three main profit areas; they would be Cow Weaning Rate (as an indicator of fertility), Sale Liveweight and Cow Liveweight (an indicator of maintenance cost).
You might be wondering why there are some very small weightings on some traits, good question! Let’s give an example: The Self-Replacing Grassfed Index has an EBV weighting of 1% (red graph) on 400-day growth. Does this mean that the animals won’t be heavy at 400-days? The answer is no, remember, the software tries to balance the EBV weightings in a way that will maximise profit for the defined target market (sale at 23 months), so it makes sense that it would place more emphasis on the area where the most profit will be obtained. I am sure it is familiar to most of you by now that there are strong positive correlations between growth traits, the larger emphasis that is placed on 600-day weight (17%) is causing the 400-day and 200-day to lift slightly (1% approximately). However, the software did not place significantly more emphasis on 400-days because that would imply an animal turning off at an age and weight that fit a 400-day market window and not a 600-day one. Does it mean we will be “going backwards” at 400-days? Again, the answer is no it means that using this index will cause smaller improvements in the areas of 200 and 400 days (if you use only this index), but they will still be improvements.
If you want to get a better idea on what the response to selection using this index would be, it would be more appropriate to look at the Green graphs. The graph reflects the relative change if the South African Simbra Published Sires were ranked on this selection index and the Top 10% selected for use within a breeding program. The response to selection may differ if a different group of animals were available for selection. The selection response will also be influenced by factors such as the genetic relationship between traits and the animals that are available for selection. For example, while there is little weighting on the 200- and 400-Day Weight EBVs (red graph) in this selection index, it would be expected that growth to 200 and 400 days would typically increase due to the significant weightings on the 600 Day Weight EBV, and the strong genetic correlation between the traits. Now you can see that the 17% emphasis on 600-day weight cause 200- and 400-day weights to increase because of the strong positive genetic correlation between them. We encourage breeders to take the time to learn about the different relationships between traits, and to apply a balanced approach to selection and avoid single trait selection to alleviate unwanted responses. Single trait selection for growth, say 600-day for example might result in increased mature cow weight and higher maintenance costs of the cow herd. Another commonly asked question is; What happens to the index if an animal does not have an EBV for a certain trait? If an animal does not have an EBV for a certain trait then the software will use a correlated trait to predict a value for that trait, this predicted value will then be incorporated into the index.
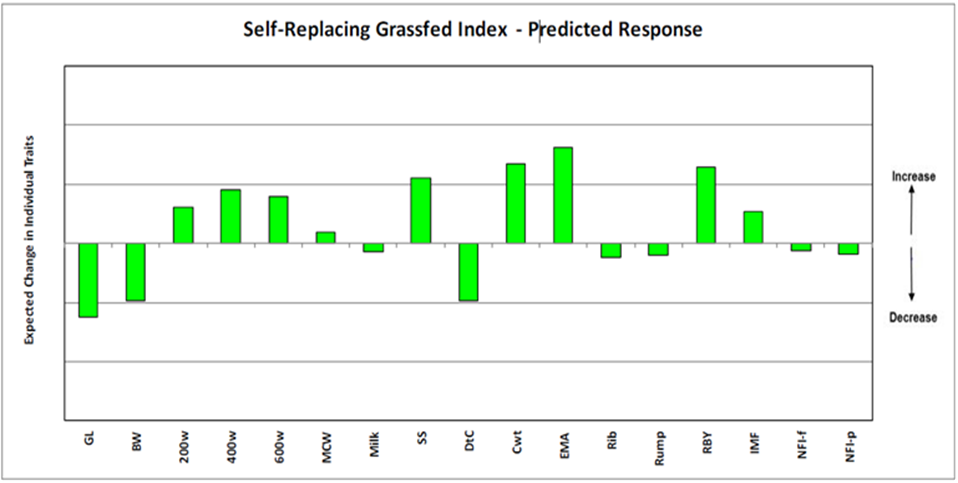
To try and wrap it up, lets refer back to the Blue Graph. We noticed that three important profit drivers were cow weaning rate (as an indicator of fertility), sale liveweight and cow liveweight (an indicator of maintenance cost). Did the index achieve this in the selection response (green graph)? A portion of cow weaning rate can be attributed to fertility (you can’t wean a calf if it wasn’t born), in the selection response graph you can see that there is a downwards response in Days to calving, indicating that the expectation is that we will see improvements in fertility. Secondly, sale liveweight, you can see that there is a positive response in 600-day weight indicating that you could expect to produce heavier progeny for that market. Thirdly, there is a very small positive response in mature cow weight, indicating that although there is improvement of sale liveweight, this does not come at the cost of heavier, higher maintenance cows indicating that a balance was obtained between correlated responses of growth traits.
So how do we interpret the actual index value? The Index value is effectively an EBV of an animal’s estimated profitability in that particular market. Selection indexes are expressed as “net profit per cow mated”. For example, if we compare a bull with an index of R400 with one that has an index of R200 we can estimate the difference in net profit from the progeny of the bulls:
½ x (R400-R200)
=R100
(Note: you multiply by ½ because only half the progeny’s genes come from the sire)
If these two bulls were joined to 200 cows during their breeding life, the difference in their selection index values would equate to a R20 000 (R100 x 200) difference in profitability between the bulls. It is important to note that this difference in profit includes profit across the entire production chain from joining, to slaughter (short term profit) and in a self-replacing herd index the long-term profit generated by a sire’s daughters.
Please keep in mind that an Index is comprised of a balanced combination of EBVs, therefore it stands to reason that just like EBVs their efficacy is influenced by the same factors that influence the accuracy of EBVs (Pedigree Performance, Own Performance and Progeny Performance).
An index is driven by the level of underlying variation for that trait, this means that for traits with low levels of recording, that have little variation, we do not always see the response that we expected. We encourage all breeders to participate in performance recording!